Aspen Discovery
Reports
 by Kalleen Marquise on Feb 3, 2022
Reports
Numbers. Data. Reports. Charts. Graphs. But what does it all mean?! Aspen Discovery has a lot of information available for library staff on what's happening behind the scenes in Aspen and how library users are interacting with the catalog. In this blog post, we break down these reports and explain where Aspen is pulling these metrics from.
Permissions
Don't see any reports with your staff login? The first thing to check before diving into reports is that you have the correct permissions to view the various reporting data. Under Administration > Permissions > Role to Edit there are a variety of staff roles to edit. To give a specific role full report access, you want to make sure that all boxes are checked under the Reporting section.
If you are unsure of the staff role you are assigned, you can check under My Account > Staff Settings to see a list of assigned roles.
If you are an Aspen Admin, you can also check the various roles assigned to each staff member under System Administration > Administration Users.
Now that we have our permissions squared away, we can login and go into the Aspen Administration to take a look at the variety of reports available. There is a main reports section called System Reports and depending what modules you have turned on, additional reports will be available in the corresponding modules.
System Reports
Within System Reports, you will see several different types of reports ranging from cron logs to information about the APIs connecting to Aspen.
- Site Status - The statuses of various Aspen components
- Usage Dashboard - Includes basic usage of Aspen. This tells us things like page views, page views by logged in users, sessions started, and the type of searches patrons are doing. The usage dashboard does break up the searches into resource based counts. (More about this later)
- API Usage Dashboard - API usage report from Aspen's various connection points
- Usage By IP Address - Reports which IP addresses have used Aspen Discovery
- Nightly Index Log - The nightly index processes configuration changes, which could include adding e-resources, changes to facets, changes to location and library system settings, or updates to the status or format mapping. The nightly index log is run when we detect changes to settings related to indexing or when new Accelerated Reader data is available (and once a week). It can be forced to run by selecting Run full index tonight from the System Variables in the System Administration section.
- Cron Log - The cron process handles periodic cleanup tasks and updates reading history for users.
- Performance Report - Tracks page load times
- Error Log - Tracking errors that show up; we're automatically monitoring this and it is mainly for our support use
- PHP Information - Display configuration information for PHP on the server
Within a few of these menus, you can click into Show Notes and/or the individual line item to get more information about the process that was run.
Usage Dashboard
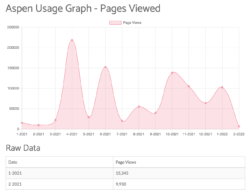
The Usage Dashboard mentioned above (and pictured below) has data corresponding to how users how interacting with Aspen.
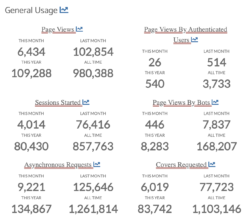
You can also click the graph icon next to the various sections to produce a graph for each category.
- Page Views - Total number of pages shown that are not by a bot and not ajax requests (pop-ups). A user can have multiple page views during one session as they navigate through pages and search results.
- Page Views - by Authenticated Users. The exact same thing as above but by logged in users. Could be staff.
- Sessions Started - Close to number of visitors. If I go and access an Aspen site, if your cookies remember the site, then it will continue the previous session. If it is not remembered, it will create a new session. We're also trying to ignore ajax requests and visits from bots. Will also be less than page views.
- Page Views By Bot - We have a list of bots that we check against- Google bot, Bing bot, etc. that are out checking the web. We try to keep the list up to date but it is possible that we are missing some. If we are missing some, then these will be counted in page views.
- Asynchronous Requests - Showing a pop up or when we load menu data. When we load how many things you have checked out or on hold. Not something libraries are likely to report on.
- Covers Requested - Total number of book covers that we're showing on search result pages. Includes covers shown in the item record like "More Like This" and "Series".
- Grouped Work Searches - Total number of searches done.
- User List Searches - When a user searches from the "list" dropdown.
- Genealogy Searches - When a user searches from the "Genealogy" dropdown.
- Open Archives Searches- When a user searches from the "History/Archives" dropdown.
- Website Searches - When a user searches from the "Library Website" dropdown.
- Blocked Pages - Blocked pages from IP address configuration. Exp: if there was a bot causing an issue, you can block that IP address. If you see a high number, it's probably worth investigating, should be low.
- Blocked API Requests - If someone was trying to make calls to the API without approval. If you see a high number, it's probably worth investigating, should be low.
- Errors - Whenever there is an error that pops up in Aspen, those are logged. This number should be low. We are monitoring and have alerts set for these.
- Web Resources - Clicks within Aspen's web resources.
ILS Integration Dashboard
Within ILS integration, in the Dashboard you can see how many patrons are logging into Aspen, submitting requests, and interacting with cataloged records. The main features of this Dashboard are:
- User Logins - Number of users that log in to Aspen
- Self Registrations - New users that register through Aspen
- Users Who Placed At Least One Hold -Users who placed at least one hold within Aspen
- Records Held - Unique number of titles or bib records with at least one hold placed on them
eContent Reporting
Aspen integrates with a number of different econtent providers. There are corresponding reporting Dashboards for Axis360, CloudLibrary, EBSCO EDS, Hoopla, and OverDrive. What's important to remember with these reports is that these just track user interactions with the econtent platforms done through Aspen. For full econtent reporting, you'd still want to check the data available within your econtent provider's reporting dashboards.
These econtent dashboards have similar data offerings, including:
- Active Users - Users within Aspen that have had successful check out or placed a successful hold
- Records With Usage - Records with usage is total number of unique titles that have been checked out or placed on hold. So that number should be less than the number of holds and loans combined.
- Loans - All successful checkouts in Aspen
- Renewals - Number of successful renewals in Aspen. Because a renewal is essentially a hold, some of those (the holds that were fulfilled and accessed via Aspen) are included in all time loans.
- Downloads - Downloads is the number of times the download button was clicked. So, if you have a user that is using Aspen to access the read online version, there would be one click for each time they opened the book OR if a user downloaded a title on one device but then needed it downloaded on another, that would result in 2 downloads for the same title.
- Options Updates - Updating their user preferences in Aspen's My Account
- API Errors - Anytime there is an error back when accessing a record; like when placing a hold or checking out and user receives an error; if you're noticing a lot of them, let us know; we're not automatically monitoring these
- Connection Failures - OverDrive entire APIs are down; should be zero for everyone
Other Reports in Aspen
You will also find reports on ecommerce, donations, side loads, open archives, and website indexing depending on what modules in Aspen your library has turned on. For the most part, these reports metrics are labeled clearly and we don't get too many support questions about them. If there is ever a time when any reports don't look correct or you are unsure where information is being pulled, please feel free to reach out to us on Slack or put in a support ticket!
Google Analytics
Some libraries extend the Aspen reporting offerings by connecting Google Analytics to Aspen to get more reporting options. At one of our Aspen Gatherings last year, Arlington Public Library did a presentation on using Google Analytics with Aspen. You can click the link to access that presentation.
Questions about how other libraries are using reports and user data would be a great discussion to have in our Aspen Partner Slack! We hope you've enjoyed learning more about reports in Aspen and documentation in the Aspen Help Manual will be updated soon to reflect all these definitions.
Read more by Kalleen Marquise